Beyond the Box Office: Understanding Ticket Sales Data
Data communication plays a crucial role in the music industry, enabling various aspects so that it functions efficiently. Graphic data, often visual or infographics, can be robust in music promotion. Visual content is engaging, easy to share on social media, and can convey complex information quickly.
In a previous post, I discussed how we build marketing funnels to set goals for our clients: Increase music sales, merchandise profits, public appearances, and sellout shows in key markets. These must be tracked and shared with industry professionals to track our KPIs and measure our campaigns effectively. Today, we’ll dive deeply into how visual data can add value to each section of the funnels we create in our marketing campaigns.
Effective Data Communication
Infographics assist us in making informed decisions, improving strategies, and fostering collaborations among various stakeholders. There are many critical areas in which data communication can be implemented, such as digital music distribution, streaming services, promotion, royalty management, etc. Music business professional Rufy Anam Ghazi explains, “Data can also help artists review their popularity per location, market, and demographics. This information can be used to plan a tour and set concert dates, as well as gauge the profitability of the tour based on the fanbase and ticket sales.”
The proof is in the data. Effective data communication is crucial to ensure that information is understood, interpreted correctly, and actionable. Data can help us to present data and insights in a clear, concise, and straightforward manner. Visual representations can make data more accessible and easier to understand. In addition, it can provide context and relate data to real-world scenarios.
Infographics also allow for easy comparison between data points. Whether it's comparing the performance of different songs, albums, or marketing channels, visuals make it straightforward to identify trends, patterns, and outliers. When I first began working in the industry, I was asked to work with artist management to create data to help assess the performance of artists, songs, albums, tours, and marketing campaigns.
Graphic Data is a simple way to digest information.
I became obsessed with market research and loved that I could identify trends, emerging genres, and growth areas, suggest what needed improvement, and have input on many publicity campaigns due to the demands of the audiences we interviewed.
“Live music revenue will increase at a compound annual growth rate (CAGR) of 3.3% heading into 2022,” Daniel Sanchez reports. “According to the calculation, the live concert industry’s total revenue will reach $31 billion in four years. Ticket sales will make up $24 billion of that total.”
Ticket Sales Data Tracking
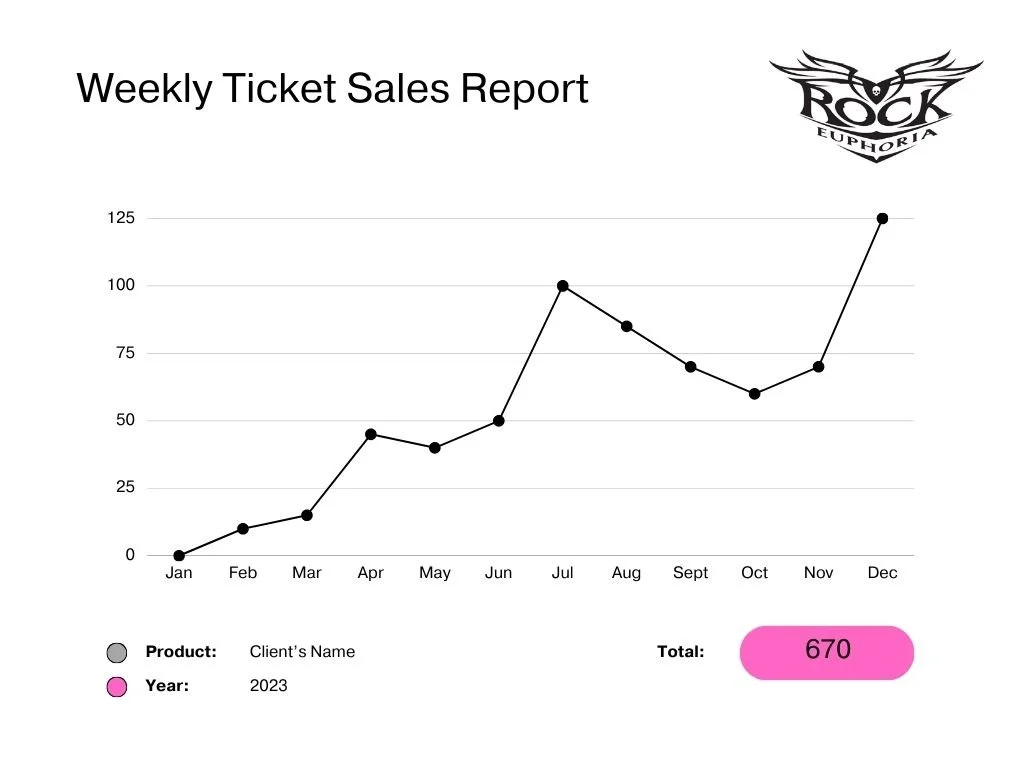
As a booking agent, tracking ticket sales data for a music show I was in charge of, was crucial for understanding my event's performance. I had to communicate with promoters and venues to get ticket counts and speak with artist management. Ticket sale data can drive us to change many areas within the artist's promotion. If sales are low or a particular market suffers, we must alter marketing and publicity campaigns, social media tactics, and media coverage.
Weekly Ticket
Sales Report
I would like to share some tactics that I have used when creating data for ticket sales in our campaigns:
Use a ticketing platform that includes reporting features and tracking.
Track which promotional channels are working best to drive ticket sales; we can do so by monitoring and tracking website traffic, referral sources, and user behavior leading to ticket purchases.
Compare ticket sales data to similar past events to assess whether your current circumstance is on track or needs adjustment. This will allow you to calculate ROI for different promotional channels and campaigns.
Engage with fans and ticket buyers on social media and through email marketing.
If you plan to sell tickets at the door or have a physical box office, ensure that these sales are accurately recorded and integrated into your overall ticket sales.
After the show, conduct a thorough post-event analysis. Review the ticket sales data, assess the event's success, and identify areas for improvement.
The ticket sales data you create will serve when it’s time to put an offer on an artist for future showtime and need to lower or increase their guarantee.
Ticket Sales
Statistics
When the show is completed, we create an additional infographic to close the front. I share this with management to analyze the artist’s performance in a particular market. I can use these to see if we need to rapidly adjust any marketing or publicity campaigns for a second national leg or an international tour. I also refer to this data when it’s time to revisit booking a term for a future album release or tour package.
Takeaways
Charts and graphs are powerful tools in music marketing because they enhance data communication, making it more accessible, engaging, and actionable for music professionals and their target audiences.
I never thought I would become a chart person. Still, after becoming a booking agent and meticulously tracking every show, it became a straightforward and convenient tool that I updated and used daily. In addition, it made it incredibly easy for me to talk with an artist's team when measuring and reviewing data to measure our client’s success.


